Cold-Weather Operability Risk
In real winter conditions, fleets routinely experienced reduced charge acceptance, significant winter range loss (often 20-50%), cold start constraints and preconditioning requirements.


Cold-Weather Operability Risk
In real winter conditions, fleets routinely experienced reduced charge acceptance, significant winter range loss (often 20-50%), cold start constraints and preconditioning requirements.
Charging Infrastructure As Primary Bottleneck
Depot-centric overnight charging models create large coincident peak electrical loads, utility interconnection delays, single point infrastructure failures.
Midlife Battery Replacement Risk
Conventional BEBs often fail within 4–5 years under heavy transit use, triggering a massive, unplanned capital expense roughly 60% of the vehicle's cost that destabilizes the long-term economic and operational viability of electric fleets.
Fleet Availability Degradation Risk
Frequent battery swaps add downtime, reducing fleet readiness.
Certification continuity risk
Swappable battery re-certifications lead to operational and cost uncertainties.
Cold-Weather Operability
LTO chemistry eliminate the need for preheating by enabling instant startup and unrestricted high-power charging in temperatures as low as -40°C
Charging Infrastructure Stability
LTO's resistance to high C-rate degradation allows for frequent, rapid charging cycles throughout the day, maximizing fleet uptime without compromising battery longevity.
No Midlife Battery Swaps
LTO chemistry delivers approximately 15,000-25,000+ charge cycles, aligning battery life with the full 15-20 year service life of a transit bus.
Fleet Availability
No constant swapping, ensuring consistent and predictable fleet operation.
Certification Continuity
No swappable battery parts or re-certifications needed.

with Powertrain System
with Redundancy Design
BMS with Redundancy
Monocoque-Design Body
Much Less Battery Waste
with Rapid Charging System
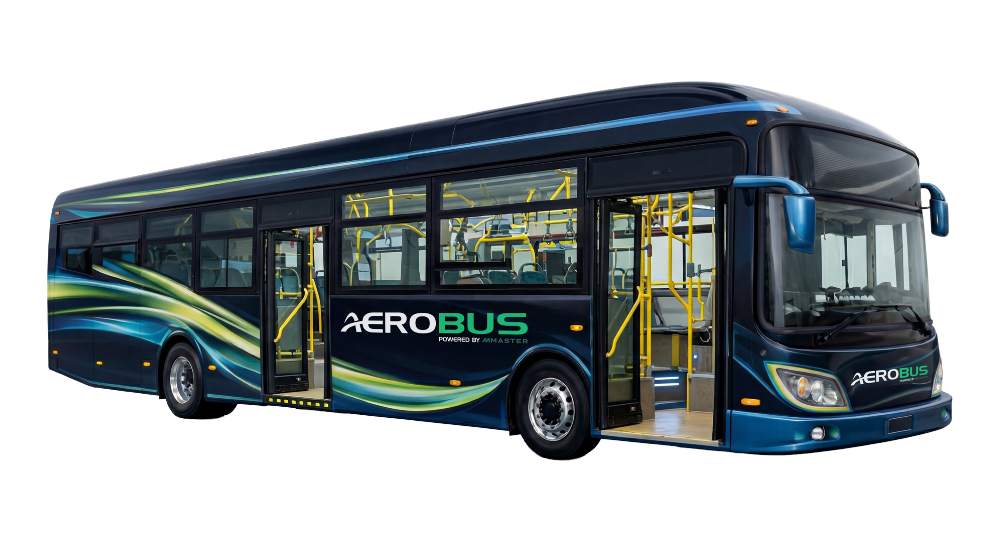
Zero-Emission Transit Solution
|
|
|
|
|---|---|---|---|
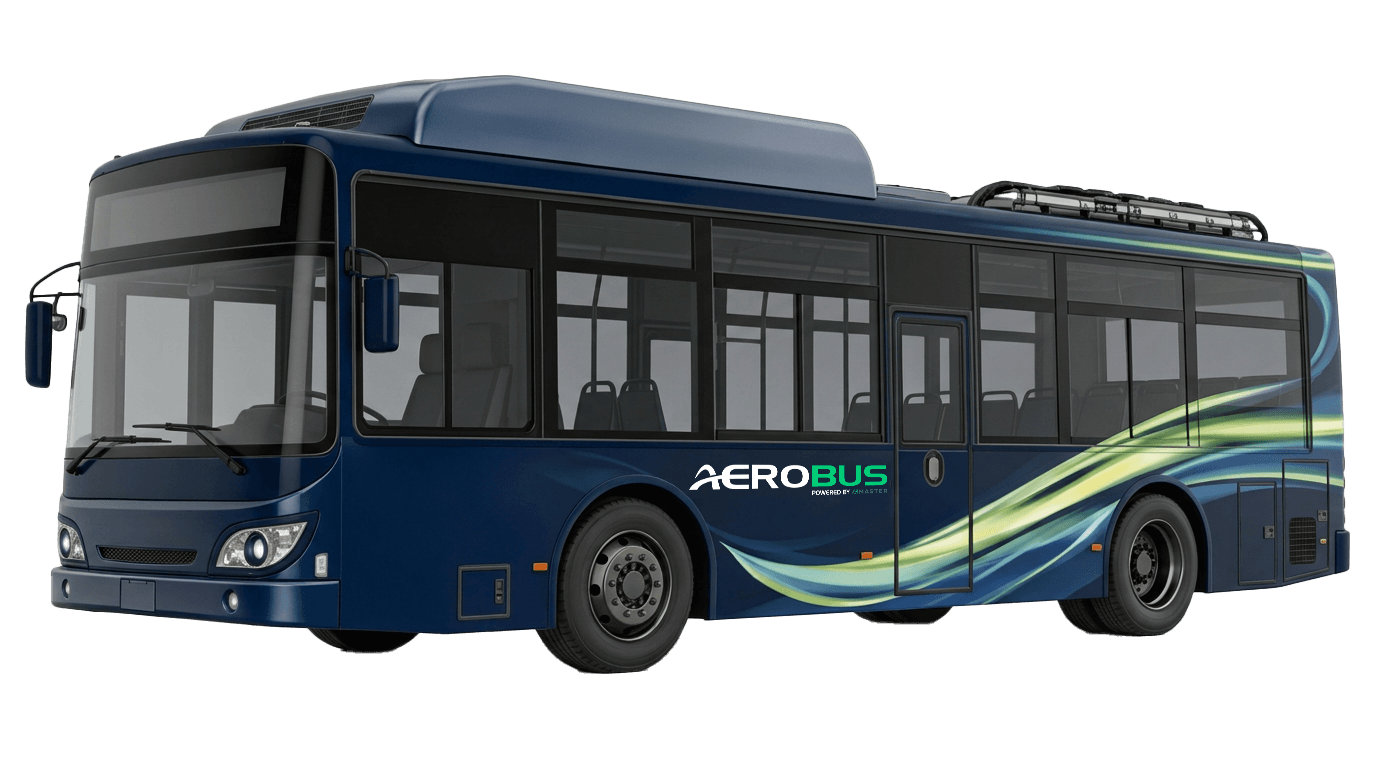
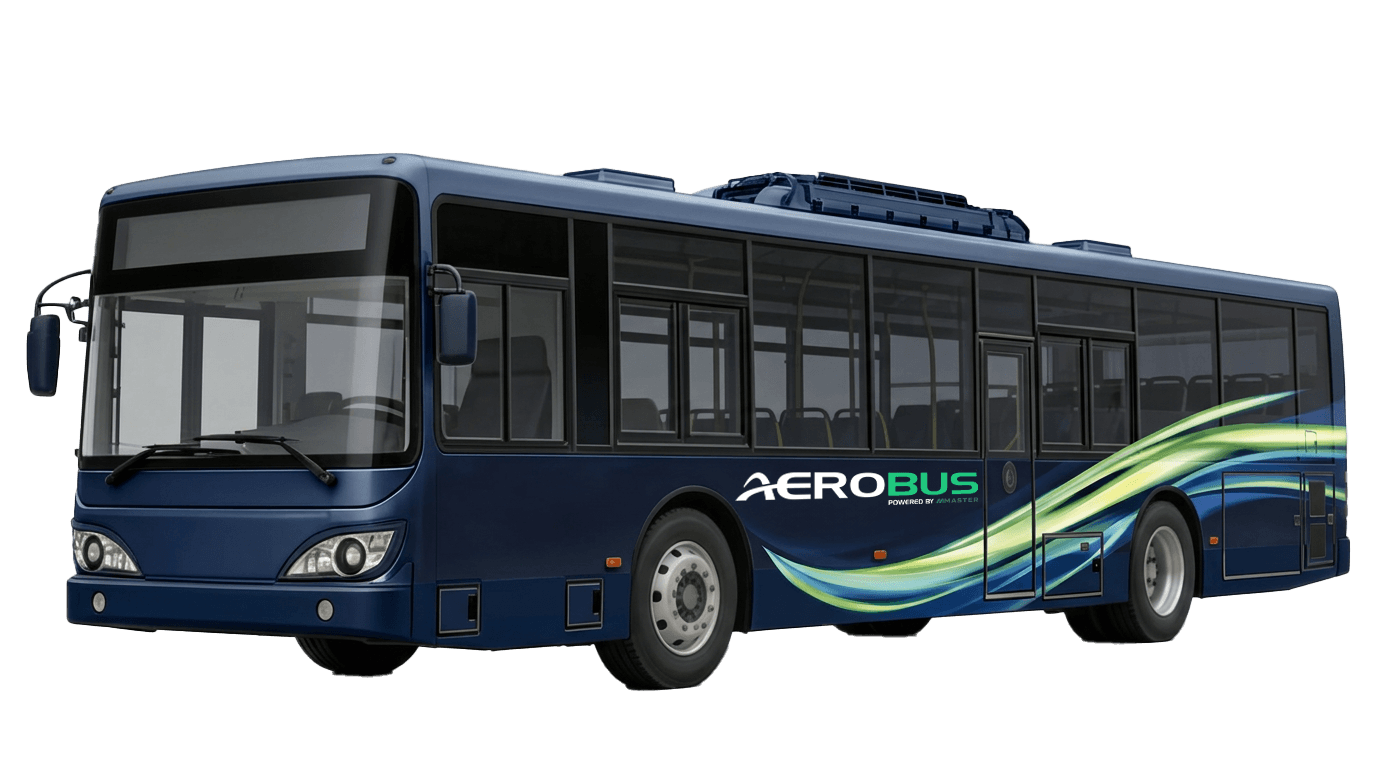
| Model / Specification | 30-feet Electric City Bus (PULSE) |
40-feet Electric City Bus (TITAN) |
40-feet Electric Intercity Bus (VOYAGE) |
| Battery Type | Lithium-Titanate Oxide (LTO) Battery | ||
| Width | Length | Height | 8 ft 2 in | 30 ft 1 in | 10 ft 11 in | 8 ft 2 in | 39 ft 11 in | 10 ft 10 in | 8 ft 2 in | 39 ft 11 in | 11 ft 3 in |
| Battery Capacity | 81 kWh | 109 kWh | 136 kWh / 218 kWh |
| Battery Lifecycle (SOC 0–100%) | 15,000 (SOC 80%) | 20,000 (SOC 70%) | 15,000 (SOC 80%) | 20,000 (SOC 70%) | 15,000 (SOC 80%) | 20,000 (SOC 70%) |
| Charging Time (SOC 20%–80%) |
**15 Min CCS | **15 Min CCS | **30 Min CCS |
| Motor Type | **Permanent-magnet Central Motor | **Permanent-magnet Central Motor | **Permanent-magnet Central Motor |
| Carrying Capacity | Seats – 21 Standing – 25 Wheelchairs – 2 |
Seats – 20 Standing – 30 Wheelchairs – 2 |
Seats – 30 or 42 Wheelchairs – 2 |
| Single Charge Mileage | **~45 miles | **~45 miles | **~45 miles / ~112 miles |
| Daily Mileage (6 Charges) |
**Over 270 miles | **Over 270 miles | **Over 270 – 672 miles |

Access a reliable charging network with clear and affordable pricing that suits your budget.

Charge from 20% to 80% SOC in just 15 minutes
Up To 111 Miles

Charging Time = Refueling Time
A Charger for 5-8 EVs:Less Charger Requirement
No Need for Redesigning Parking Space for EVs & Charging Station
Divide Charging Time: Low Impact to the Power Grid
Nearly Zero Risk, Noise, Impact
Electric buses reduce per-km energy costs by up to 88% compared to diesel. Eliminate routine engine maintenance, reducing service intervals by 60%. Total cost of ownership over 10 years is 35–50% lower, making the AeroBus platform the most economical fleet investment available.
Transition away from fossil fuel price volatility. With V2G integration and solar-compatible charging infrastructure, transit agencies can achieve up to 40% energy self-sufficiency, locking in predictable operational costs for decades.
Each 100-bus AeroBus deployment creates an estimated 45 direct local jobs in charging infrastructure, maintenance, and fleet operations — plus 120 indirect jobs in the supply chain. AeroBus partners with local vocational programs to train the next generation of EV technicians.
AeroBus technology is certified for deployment across 28 countries. Partner cities and transit authorities that adopt AeroBus early gain preferred manufacturing and export rights, enabling revenue generation from regional technology transfer agreements worth up to $15M per market.
| Bus Type | Diesel City Bus | Rapid Charge City Bus |
|---|---|---|
| Operating Duration | 10 Year | |
| Annual Operating Mileage |
55,000 KM / Year (220 km per day / operate 250 days) |
|
| Energy Price |
3.71 USD/ gal (USD 0.98/L for whole sale in USA) |
0.09 USD/ kWh (USD 0.081–0.09/kWh for industrial electricity cost in USA) |
| Energy Consumption | 5.17 miles / gal | 1.0 KM / kWh |
| Energy Cost per KM | 0.731 USD/ mile | 0.09 USD/ KM |
| 10-Year Energy Cost |
0.731 USD/KM * 10 Years * 55,000 KM = 402,050 USD |
0.09 USD/KM * 10 Years * 55,000 KM = 49,500 USD |
| Percentage (%) |
100.0
352,550 USD 87.7 % 12.3 |
|
Data Disclosure: Performance and cost metrics are derived from localized transit testing conducted in Taiwan. Figures reflect regional energy tariffs, specific climate conditions, and local duty cycles. Actual TCO (Total Cost of Ownership) will vary by jurisdiction based on grid demand charges, regional fuel volatility, and environmental extremes.